The prosperity index was developed with support from a Technical Expert Panel (TEP) convened by Betty-Ann Bryce, while detailed to the White House Office of National Drug Control Policy as Special Advisor for Rural Affairs from the U.S. Department of Agriculture, Rural Development agency. TEP members represented a diverse group of stakeholders with a wide range of expertise. The TEP included: Anita Chandra (RAND Corporation), Courtney Cuthbertson (University of Illinois at Urbana-Champaign), Alison Davis (University of Kentucky), Marjory Givens (Wisconsin Public Health Institute; County Health Rankings), Shannon Monnat (Syracuse University), Robert Pack (East Tennessee State University), Laura Palombi (University of Minnesota), Khary Rigg (University of South Florida), David Terrell (Indiana Communities Institute, Paul State University) Brian Smedley (National Collaborative for Health Equity), and Sarah Willen (University of Connecticut).
The prosperity index provides a single numerical measure designed to reflect the prosperity of a county. For the overall prosperity index score, 1 represents most prosperous counties and 5 represents least prosperous counties. For the component scores, 1 represents lowest risk or highest resilience and a score of 5 represents highest risk or lowest resilience.
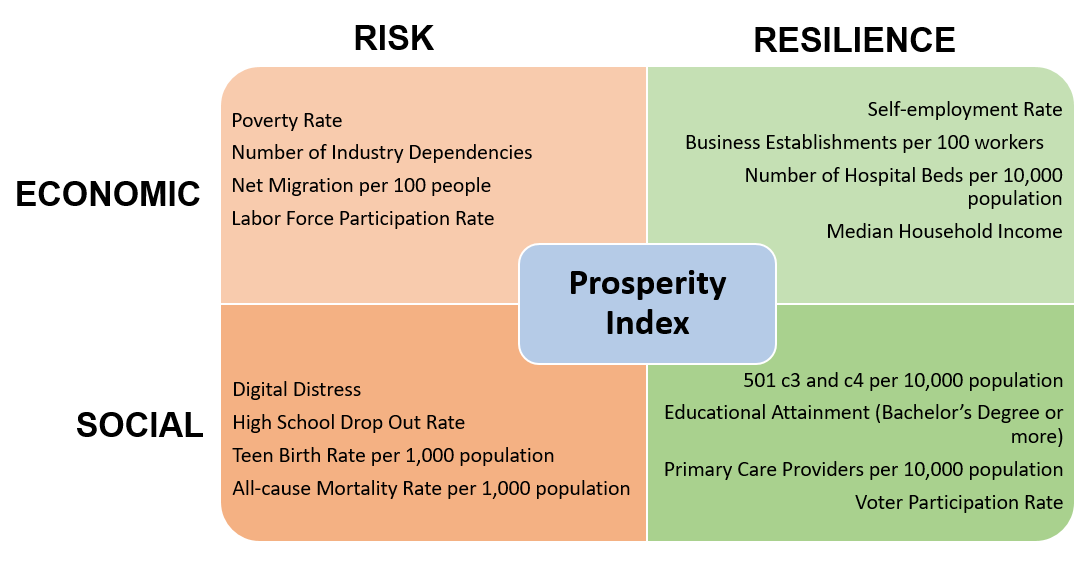
The prosperity index is calculated for each county in the United States using standardized values of 16 indicators belonging to one of four component classes associated with prosperity. The four components represented are Economic Risk, Economic Resilience, Social Risk, and Social Resilience. Each of these four components is comprised of four indicators reflecting aspects of that dimension that are aggregated to create the component score.
The economic dimensions, risk and resilience, provide two numerical measures for the degree to which a county is economically vulnerable to, or protected from the effects of public health and well-being challenges and crises. The economic risk experienced by a county is qualified or mitigated by its level of economic resilience, the strength of its protective factors.
Similarly, social risk and social resilience both have a role in determining the vulnerability of a county. Taking both economic factors and societal factors into consideration gives the most complete picture of the county and can help users refine focus for initiatives that seek to improve quality of life by reducing risk and increasing resilience.
The index may provide benefit to public health officials in counties where a certain level of vulnerability may exist even though a crisis has not yet been experienced. Proactive exploration of the index and digging deeper into the factors that it highlights will allow end users to reduce the likelihood or severity of these crises.
Indicators were selected based on several criteria, including the ability to influence the indicator at the local level, the availability of county-level data that is consistently reported and publically available, and data that could be considered indicators of community-level prosperity. Indicators that were suggested but ultimately not included in the prosperity index due to data limitations or challenges are: access to transportation, income inequality, and access to early childhood education.
| Component |
Indicator |
Data Source |
Calculation Method |
| Economic – Risk |
Poverty Rate |
U.S. Census Bureau, ACS 5-year estimates
(2014-2019) |
Percentage of individuals below poverty |
| Number of Industry Dependencies |
USDA Economic Research Service
(2015) |
Total number of industry-dependencies calculated from binary indicators for industry-dependence (mining, farming, manufacturing, recreation) |
| Net Migration per 100 people |
Census Population Totals and Components of Change
(2020-2022) |
Net migration rate was calculated by pulling the total net migration (domestic and international) between July 1st 2021 and July 1st 2022, then dividing it by the population of the county on July 1st 2021.. |
| Labor Force Participation Rate |
U.S. Census Bureau, ACS 5-year estimates
(2017-2021) |
Among the civilian non-institutionalized population aged 25 to 54, the percentage that is working or actively looking for work |
| Economic – Resilience |
Self-employment Rate |
U.S. Census Bureau, ACS 5-year estimates
(2017-2021) |
Percentage of total workforce self-employed in own incorporated business |
| Business Establishments per 100 workers |
U.S. Census - County Business Patterns
(2018) |
Number distinct business establishments per workers 16 years and older |
| Number of Hospital Beds per 10,000 population |
HRSA Area Health Resources Files
(2019-2020) |
Number of hospital beds per 10,000 population |
| Median Household Income |
U.S. Census Bureau, ACS 5-year estimates
(2017-2021) |
Median household income in the past 12 months (in 2017 inflation-adjusted dollars) |
| Social – Risks |
Digital Distress |
Purdue Center for Regional Development: Digital Distress Indicator
(2017-2021) |
- 1 = Low digital distress
- 2 = Medium digital distress
- 3 = High digital distress
(Based on data from ACS on internet subscription, access, and computing devices.)
|
| High School Drop Out Rate |
U.S. Census Bureau, ACS 5-year estimates
(2017-2021) |
Percentage of persons aged 16 to 19 years who neither graduated from, nor are currently enrolled in, high school |
| Teen Birth Rate per 1,000 population |
CDC NCHS
(2018) |
Estimated teen birth rates for females aged 15 to 19 years per 1,000 |
| All-cause Mortality Rate per 100,000 population* |
CDC NCHS NVSS – Multiple cause of death data
(2019) |
Number of deaths of all causes per 100,000 population (age-adjusted) |
| Social – Resilience |
501 c3 and c4s per 10,000 population |
Internal Revenue Service (IRS)
(2020) |
Number of 501 c3 and c4 organizations per 10,000 population
|
| Educational Attainment- Bachelor’s Degree or more |
U.S. Census Bureau, ACS 5-year estimates
(2017-2021) |
Percentage of population 25 years and older with a Bachelor's, Master's, Professional, or Doctorate degree |
| Primary Care Providers per 10,000 population |
HRSA Area Health Resources Files
(2019-2020) |
Number of primary care physicians, nurse practitioners, and physician assistants per 10,000 population |
| Voter Participation Rate^ |
MIT Election Data and Science Lab
(2018) |
Percentage of eligible voters that voted in the 2016 presidential election |
*The all-cause mortality data did not have mortality rates for about 80 counties. For these counties the mortality subcomponent did not contribute a positive or negative result to the overall score (effectively a mean imputation).
^The voter turnout indicator was not readily available for Alaska since the raw data included voter totals by Congressional House District. A proportional allocation method based on population overlap was devised to estimate the voter turnout for each county (borough) in Alaska.
The prosperity index is calculated for each county in the United States using standardized values of 16 indicators belonging to one of four component classes associated with prosperity. The four components represented are Economic Risk, Economic Resilience, Social Risk, and Social Resilience. Each of these 4 components is comprised of 4 subcomponents reflecting aspects of that dimension that are aggregated to create the component score.
Each indicator, also known as a subcomponent, was scaled to have a mean of 0 and a standard deviation of 1. This is referred to as the standardized subcomponent value. Then a clustering algorithm grouped all of the counties into 5 homogenous groups according to the standardized values thus providing a score (1 through 5) for each county for each subcomponent.
At the component level, the 4 subcomponent standardized values within the component are summed to create a component value. The counties are then clustered according to the component value to create the component scores 1 through 5.
Finally the component values are summed for each county to create the prosperity value. The counties are then grouped into 5 classes with 1 representing the most prosperous and 5 representing the least prosperous. This 1-to-5 score is the final prosperity index score.